shotChart part 1: Scraping shots from basketball-reference
[web scrapping python datasets sports Web spider to crawl the shot chart data from basketball-reference.com
In this post I’ll be introducing shotChart, a web spyder created using scrapy (python library) to get the shots from basketball-reference.com. It will mainly be focused on how it was implemented.
To see how to use it check https://github.com/theccalderon/shotChart
Index:
Motivation
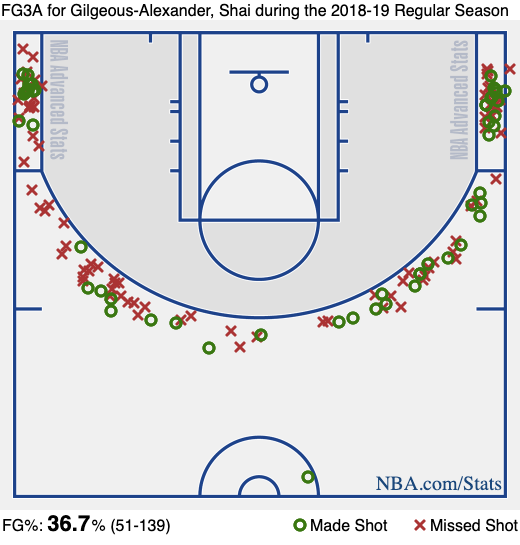
One my favorite basketball charts is the shot chart. First of all, it looks really cool but, we are not Jerry Seinfeld so we don’t only care about what’s important to the superficial man 1.
Shot charts are plots of the location and result of each shot taken during a game. It can be used to improve a team’s ability to defend a certain player or team by using shot data to make inferences about the player’s tendencies and abilities. Every time I read or listen to a basketball player say: “… I need to get to my spots…” well, they usually mean the areas of the court where they are most efficient/confident they can score.
Since I love to use python along with Jupyter notebooks to analyze data, I created this web crawler to retrieve the shot chart data from basketball-reference.com and potentially develop a library that can be used to plot/analyze it. I also wanted to share the shot chart data in tabular form to see what can we do with it.
For readers interested in how this web crawler was implemented, please see Usage and Implementation sections. If you are only here for the data(smart decision btw), you can skip ahead to Datasets.
Usage
git clone git@github.com:theccalderon/shotChart.gitpip install -r requirements.txtscrapy crawl basketball-reference -o ./shotChart/data/shots-2000.csv -a season=2000
For more information on how to use, see https://github.com/theccalderon/shotChart.
Implementation
I won’t go deep into how to use scrapy since they have great tutorials in their documentation. I’m going to try to outline and explain the main parts of the code.
The calendar.json file has the start and end dates for each one of the NBA seasons (regular and playoffs) starting in 2000. This file is used to loop to every game every day of the season.
Now, the main dish (actually this posts is more like a week day lunch so… there is only one dish) basketball-reference.py.
As you would think, the idea behind the code should be something like the following (yayyyyy I’m going to use pseudo-code!):
for day from startDate to finishDate:
    list_of_games <- list of games in day
    for game in list_of_games:
      return list_of_shots
Now that’s easy, why am I even reading this post????? Well, we do need to know how to use dynamic dates to go through each day, how to get the list of games for one day and how to get the actual shots.
Iterating through each day:
Since we have the start and end dates for the season (calendar.json) we can use the following code to iterate through each day:
from datetime import date, timedelta
start_date = date(start_year, start_month, start_day)
end_date = date(end_year, end_month, end_day)
delta = timedelta(days=1)
while start_date <= end_date:
    year = str(start_date).split('-')[0]
    month = str(start_date).split('-')[1]
    day = str(start_date).split('-')[2]
    urls.append('https://www.basketball-reference.com/boxscores/?' + 'month=' + month + '&day=' + day +
                '&year=' + year)
    start_date += delta
The code above creates two dates objects for the start and end date. We then proceed to get the year, month and day for each day since the format of basketball-reference is https://www.basketball-reference.com/boxscores/?month=MM&day=DD&year=YYYY. We need to store each one of these urls to later get the list of shots from each game that day. Finally, we increment the start_date by our delta (in this case just 1 day).
Getting the list of games per day:
For each day (each URL), we proceed to then get the list of games, see below:
for game in response.css('div.game_summary.expanded.nohover'):
  next_page = game.css('p.links a::attr(href)')[2].get()
The most important part of the code above is how we get the next_page, which in this case means the actual shot chart. 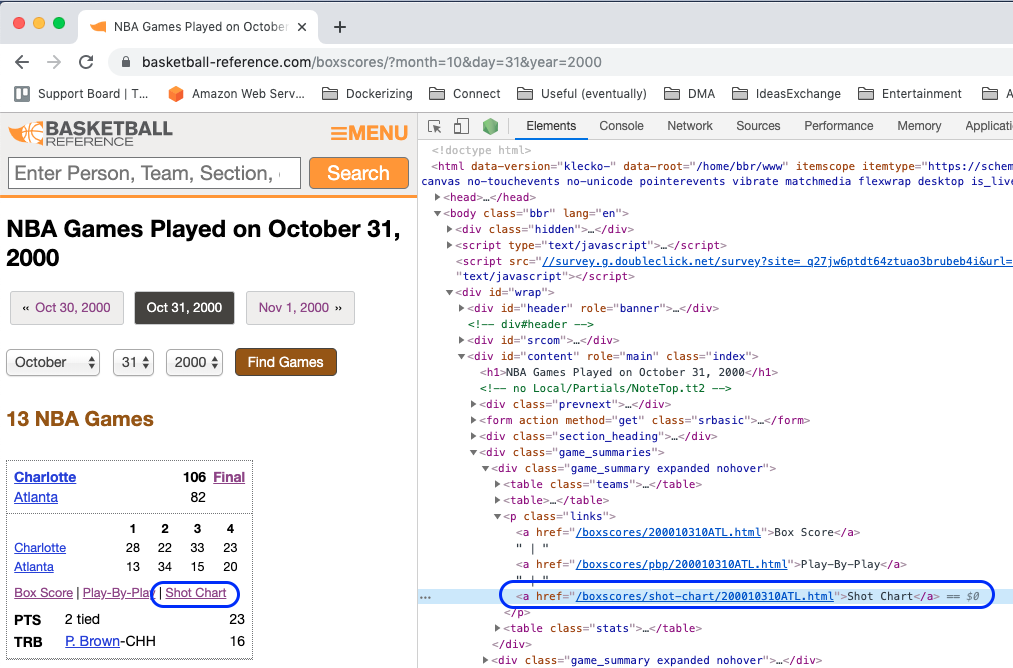
As you can see in the image, we can navigate to the shot-chart by appending /boxscores/shot-chart/200010310ATL.html to https://www.basketball-reference.com/. So that’s game in list_of_games.
Getting the list of shots
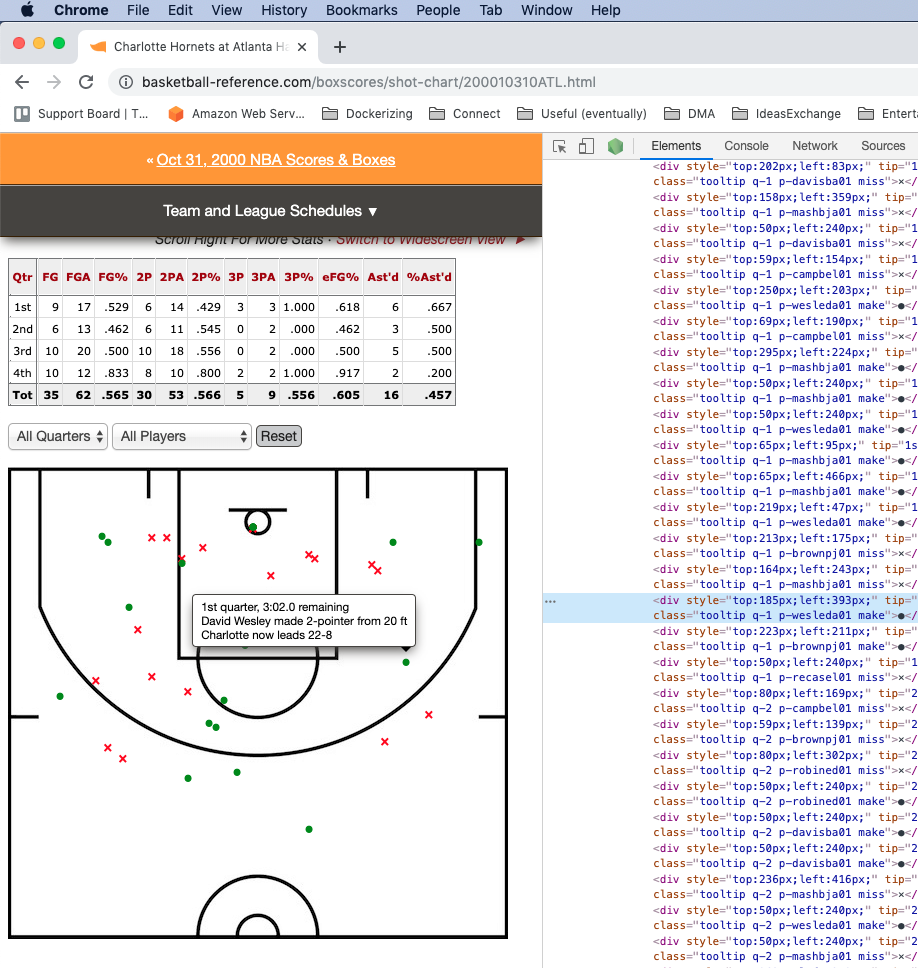
As you can see, we have a shot chart for each team ( 2 shot charts) per game. We do have two divs formatted as <div is="shots-XXX" class="shot-area"> where XXX stands for a team. Under each one of these 2 divs, we have a list of divs with each one of the shots.
for chart in response.css('div.shot-area'):
    for shot in chart.css('div.tooltip'):
        style = str(shot.css('::attr(style)').get()).split(';')
        shot_description = str(shot.css('::attr(tip)').get())
        ...
        ...
We select the divs with class shot-area and iterate thorugh them. We then select the divs with class tooltip and we get the shot information.
Datasets
This scraper has already been executed for each season starting in 2000 and the datasets are publicly available (I did a little bit of feature engineering on the original datasets) at:
- 2000-2001
- 2001-2002
- 2002-2003
- 2003-2004
- 2004-2005
- 2005-2006
- 2006-2007
- 2007-2008
- 2008-2009
- 2009-2010
- 2010-2011
- 2011-2012
- 2012-2013
- 2013-2014
- 2014-2015
- 2015-2016
- 2016-2017
- 2017-2018
- 2018-2019
- 2019-2020
Future work:
I will try to use the image below and columns x and y in the datasets to plot shot distributions, shots per player, shots by distance……… Hit me up if you’d like to contribute on that.

References
-
Jerry Seinfeld,The Switch: “She has many other qualities admired by superficial man.” ↩