shot_chart
Shot Chart
#hide
from shot_chart.core import *
This file will become your README and also the index of your documentation.
Install
pip install shot_chart
How to use
We first create a pandas dataframe from the source data.
shots_2019 = make_df(untar_data(URLs.SHOTS_2019))
Listing teams for the season
list_teams(shots_2019)
0        New Orleans
2            Toronto
203        LA Lakers
204      LA Clippers
369          Houston
371       Washington
563             Utah
724          Detroit
896        Charlotte
897       Sacramento
1076       Minnesota
1077    Philadelphia
1248        New York
1250         Orlando
1418        Oklahoma
1419        Portland
1587         Phoenix
1588    Golden State
2117          Dallas
2307         Memphis
2309         Chicago
2649          Denver
3000        Brooklyn
3874       Milwaukee
4562     San Antonio
5436         Indiana
5606          Boston
5951         Atlanta
6863           Miami
6864       Cleveland
Name: team, dtype: object
Listing players who took at least 1 shot for a particular team
list_team_players(shots_2019, 'Portland')
| | shots_by | count |
|-----|------------------|-------|
| 2 | CJ McCollum | 1356 |
| 5 | Damian Lillard | 1344 |
| 4 | Carmelo Anthony | 781 |
| 7 | Hassan Whiteside | 702 |
| 0 | Anfernee Simons | 532 |
| 6 | Gary Trent | 440 |
| 10 | Kent Bazemore | 322 |
| 11 | Mario Hezonja | 217 |
| 14 | Rodney Hood | 172 |
| 16 | Trevor Ariza | 159 |
| 13 | Nassir Little | 151 |
| 15 | Skal Labissière | 147 |
| 1 | Anthony Tolliver | 117 |
| 9 | Jusuf Nurkić | 109 |
| 18 | Zach Collins | 68 |
| 3 | Caleb Swanigan | 43 |
| 8 | Jaylen Hoard | 32 |
| 17 | Wenyen Gabriel | 31 |
| 12 | Moses Brown | 10 |
Plotting team shot distribution
houston = TeamShots(shots_2019,"Houston")
houston.plot_shots()

houston.plot_shots(date_range=((2020,1,3), (2020,1,11)))

Please check the extra options when using the plotting functions
portland_20191125 = TeamShots(shots_2019,"Portland")
portland_20191125.list_game_ids(2019,11,25)
| | game_id | winner | loser |
|-------|--------------|----------|---------|
| 46637 | 201911250CHI | Portland | Chicago |
portland_20191125.plot_shots("201911250CHI")
Plotting player shot distribution
player_shots = PlayerShots(shots_2019,"Anthony Davis")
player_shots.plot_shots()
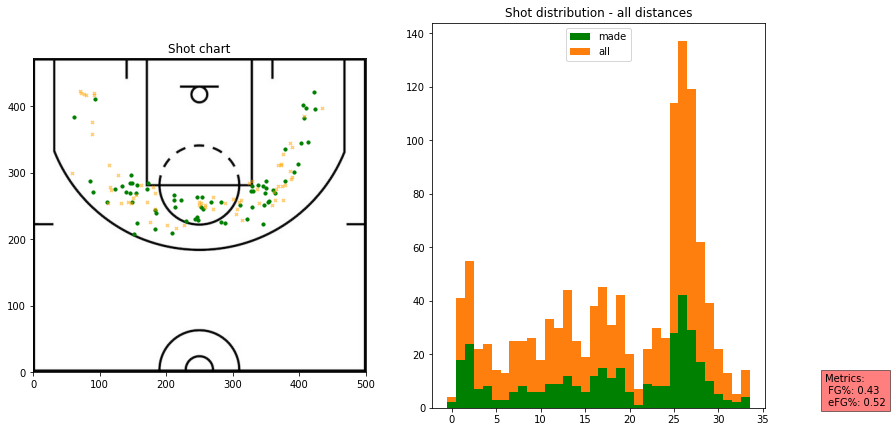
dlo = PlayerShots(shots_2019,"D'Angelo Russell")
dlo.plot_shots()
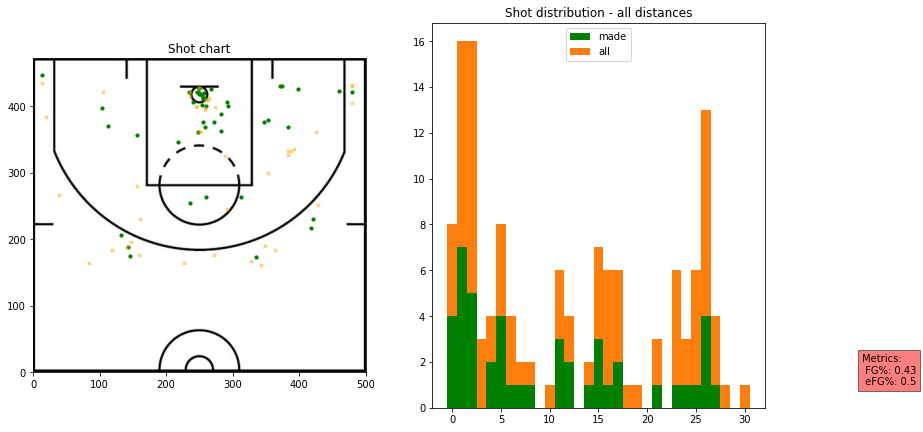
dlo.plot_shots(distance_limit=(16,26),attempt="2-pointer")
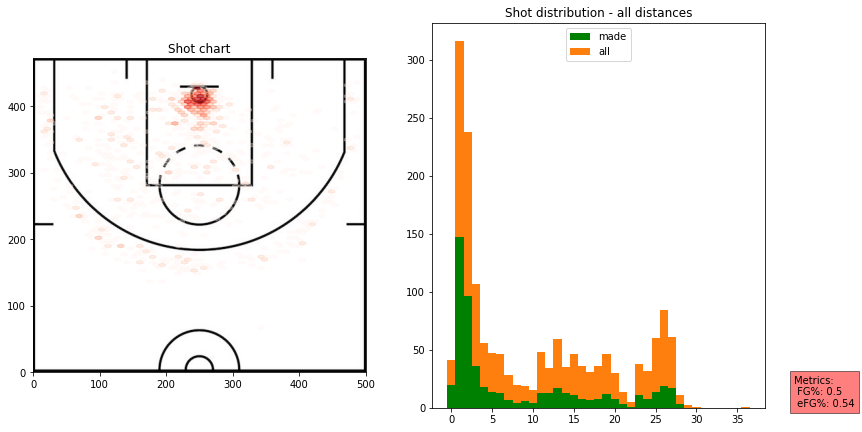
dlo.plot_effective(most_or_least="most")
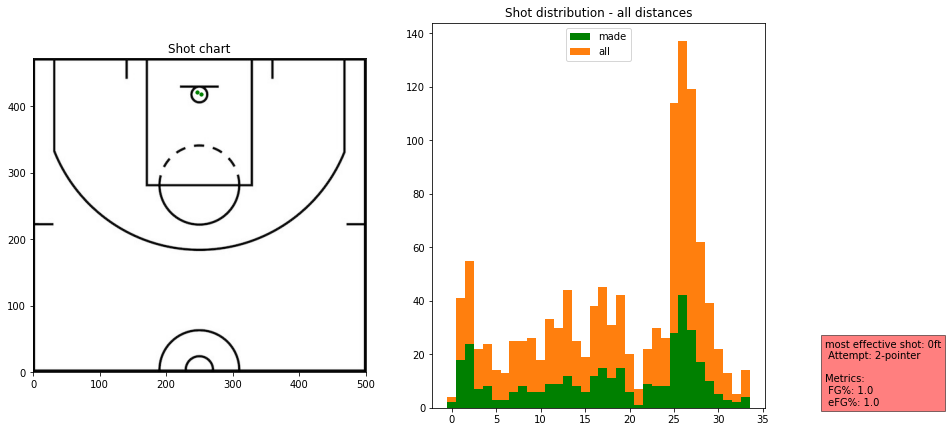
dlo.plot_effective(most_or_least="most",exclude=["0ft"])

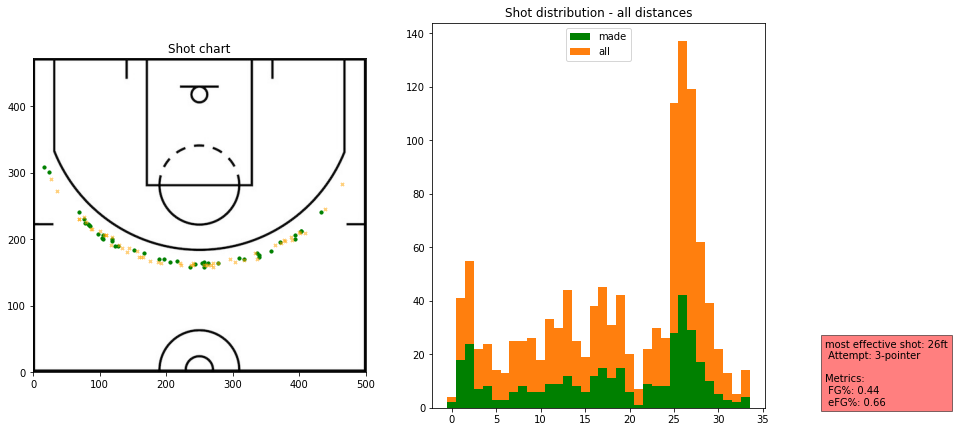
dlo.plot_effective(most_or_least="most",min_shots="auto",exclude=['2ft'])
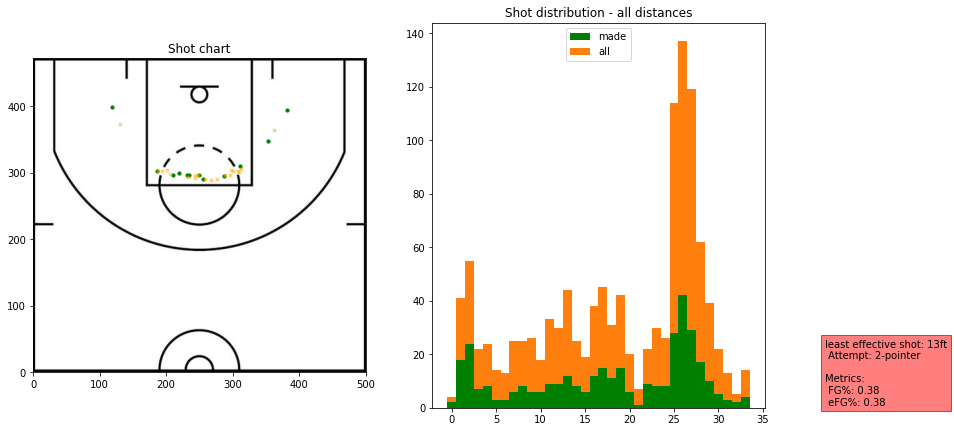
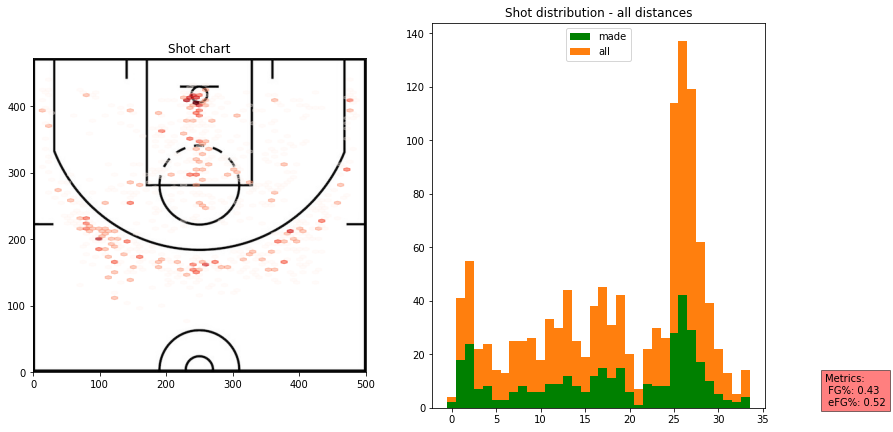
dlo.plot_effective(most_or_least="least")
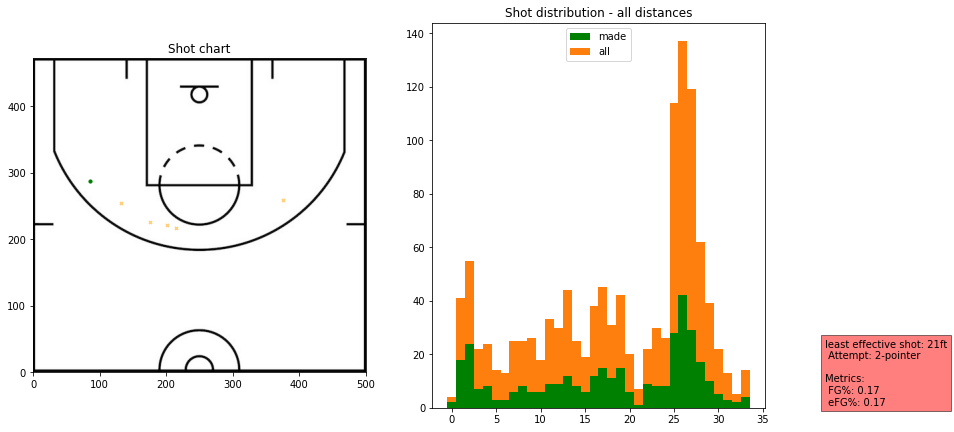
dlo.plot_effective(most_or_least="least",min_shots="auto")